new
SERP Project Dashboard
Introducing your new project overview dashboard
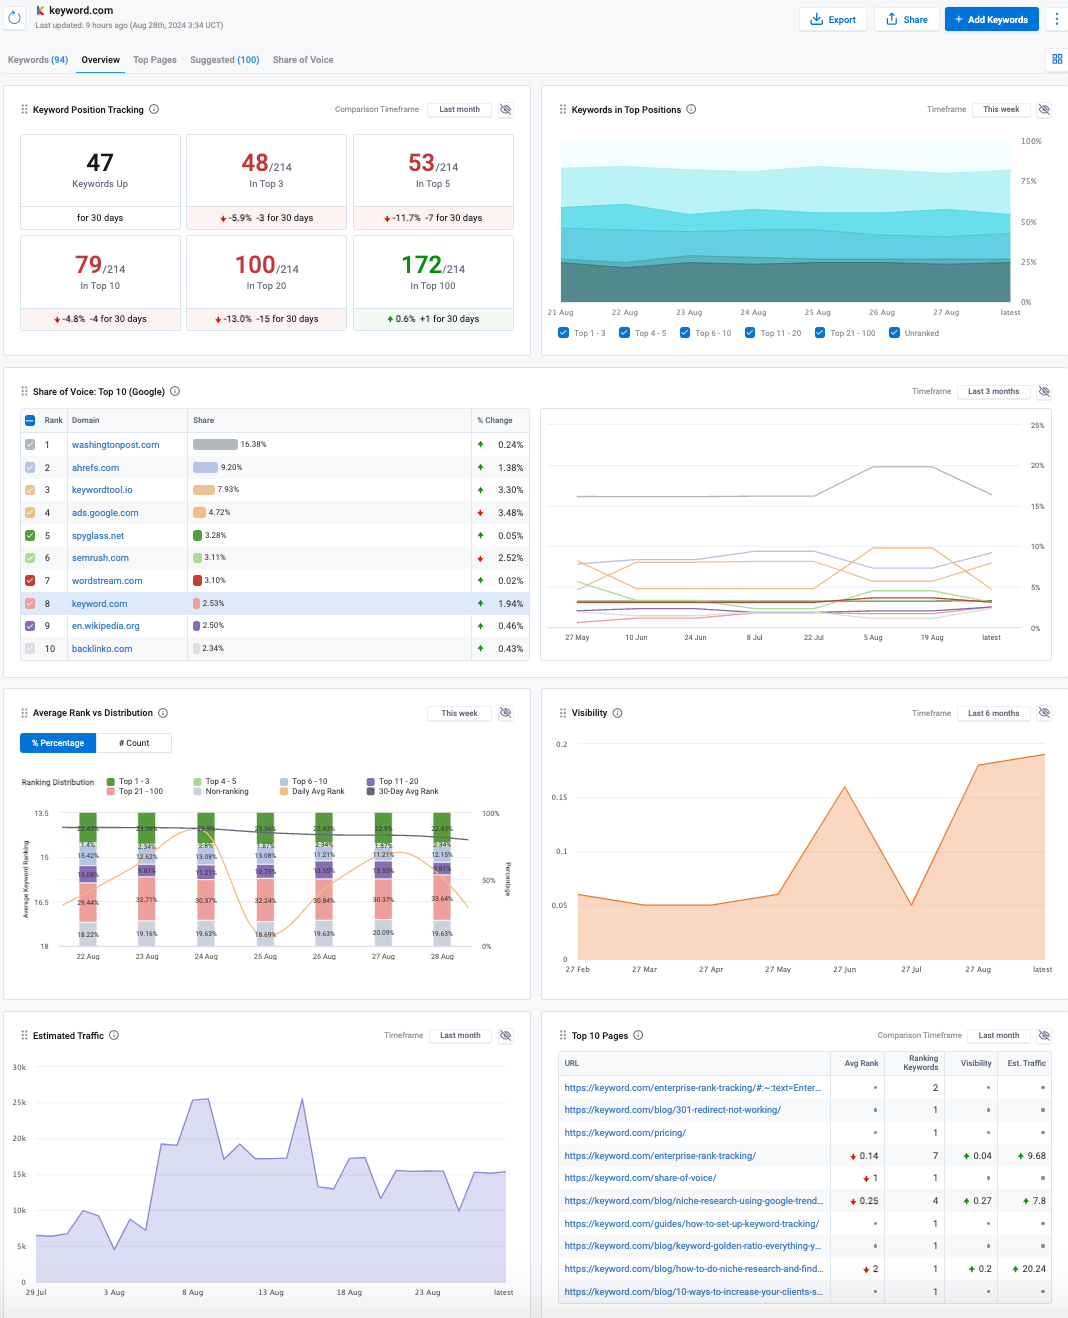
We’re excited to introduce the new Project Overview Dashboard, a powerful tool designed to give you a comprehensive snapshot of your project’s performance.

This dashboard consolidates key metrics and insights into a single, customizable view, allowing you to monitor your rankings, keyword distribution, organic traffic, and more at a glance.
Key features include:
- Drag-and-Drop Interface: Tailor your Overview tab by rearranging the 11 available charts to prioritize the metrics that matter most to you.
- Advanced Date Filtering: Each widget now supports advanced date filtering, letting you customize date ranges per chart, project, or group. Filters are automatically saved, ensuring consistent data analysis.
- Chart Customization: Add or remove charts, adjust timeframes, and optimize your dashboard to reflect your specific SEO goals.
Some of the key charts include:
- Average Rank vs. Distribution: Analyze the distribution of keywords across ranking tiers and track your average rank over time.
- Organic Traffic Acquisition by User Channel:Compare organic search performance month over month with insights from Google Analytics 4.
- Share of Voice: Benchmark your visibility against competitors and track your SEO performance over time.
- Visibility: Evaluate your website's presence in Google's organic search results, helping you refine your SEO strategy.
- Estimated Traffic: Forecast potential website traffic based on your keyword performance and search trends.
- Average Rank:Monitor your SEO performance with daily and 30-day average rank insights.
- SERP Feature Performance: Gain insights into how often your content appears in SERP features like featured snippets and local packs.
Note: The Overview Page customization is not yet available in ViewKey.
Read more about these features and charts here.